I created a simple app which collects data using perl, stores the information using rrd files and plots it using jquery (flot, etc).
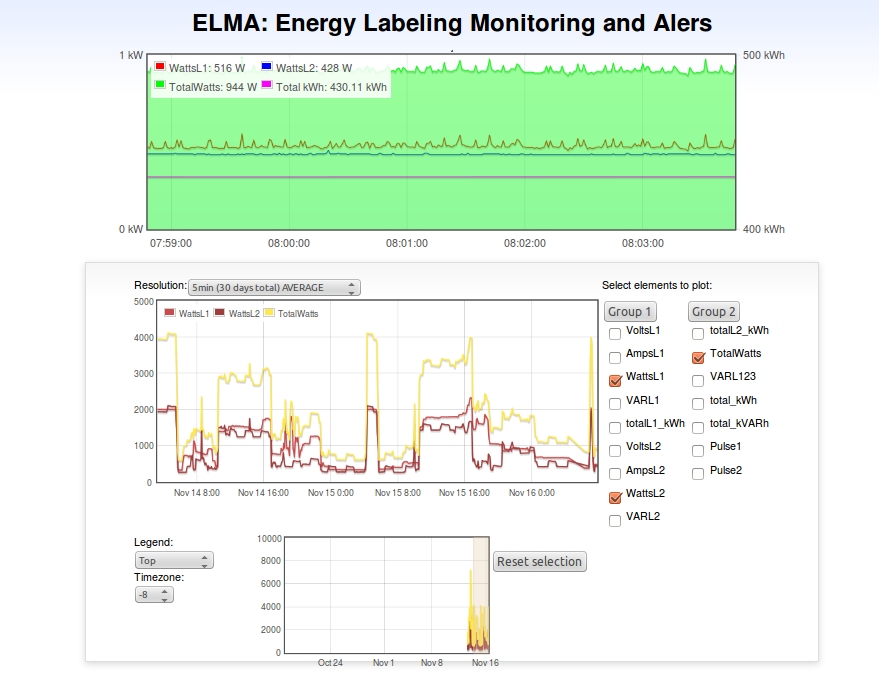
The graphs allow you to look at stored data as well as real time (1 sec) data.
The project is on git hub at https://github.com/lelazary/elma
There are only two source files to look at,
the perl program: https://github.com/lelazary/elma/blob/m ... adMeter.pl that reads and parses the meter data (saves the output into a json and rrd)
the web graphing program: https://github.com/lelazary/elma/blob/m ... /index.php
I plane on creating some advance features to identify and label major appliances, as well as generate alerts for abnormal behavior (water leak, unusual power usage, etc.).
Simple perl collector with rrd and graphs
Last edited by lelazary on Sun Nov 16, 2014 8:56 am, edited 1 time in total.
Re: Simple perl collector with rrd and graphs
This is awesome, I love it!!
I like how you can choose from a 30 day time period, I am very curious to follow how this project progresses
Thank you very much for posting this here!
I like how you can choose from a 30 day time period, I am very curious to follow how this project progresses
Thank you very much for posting this here!